Debugging Drupal
This page gives a brief overview of some of the tools you can use to make Drupal development and debugging easier.
It covers the Devel contrib module, the Drupal for Firebug contrib module and Firefox extension, the FirePHP library, and the combination of NetBeans and Xdebug.
This guide has a companion module available at Drupal.org. Post corrections or additions in the issue queue.
Devel module
In addition to the core module, the Devel package contains some other useful modules:
- Devel generate: Generates dummy users, nodes, and taxonomy terms.
- Theme developer: Displays theme API information for theme developers. (Note that this module doesn’t work if Drupal for Firebug is enabled.)
These modules are not covered in this guide. See the Drupal handbook for more information. Installation
- Download and install the latest version of the Devel module from Drupal.org.
- Go to Administer → Build → Modules and enable the Devel module.
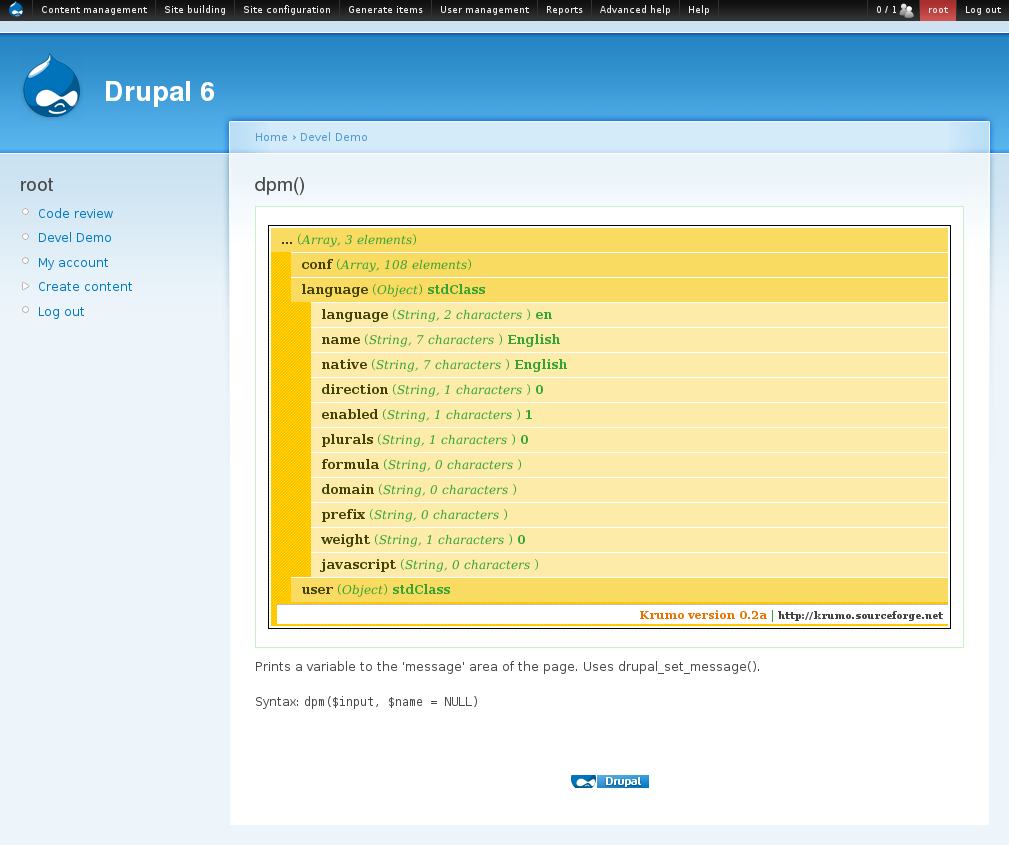
dpm()
Prints a variable to the ‘message’ area of the page using drupal_set_message(). You can use this function to keep track of one or more variables when you’re working on the code running your site. Because the Devel module now comes with Krumo, the output is compact and unobtrusive.
dpm($input, $name = NULL)If, for some reason, you are not using Krumo, you can use the $name parameter to distinguish between different calls to dpm().
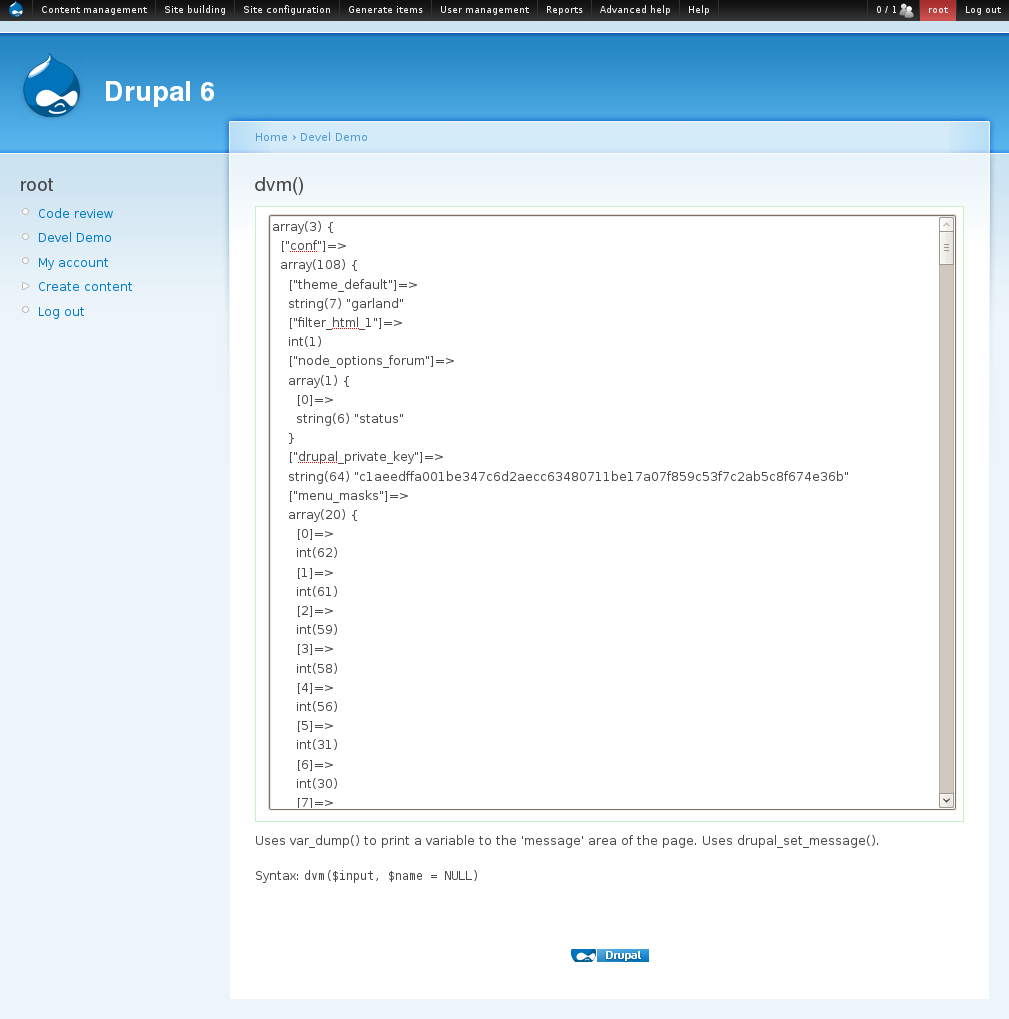
dvm()
Uses var_dump() to print a variable to the ‘message’ area of the page using drupal_set_message(). The output of this function is harder to read than the Krumo-based output of dpmt(), but it can be useful if you need to copy and paste it to another application.
dvm($input, $name = NULL)If, for some reason, you are not using Krumo, you can use the $name parameter to distinguish between different calls to dvm().
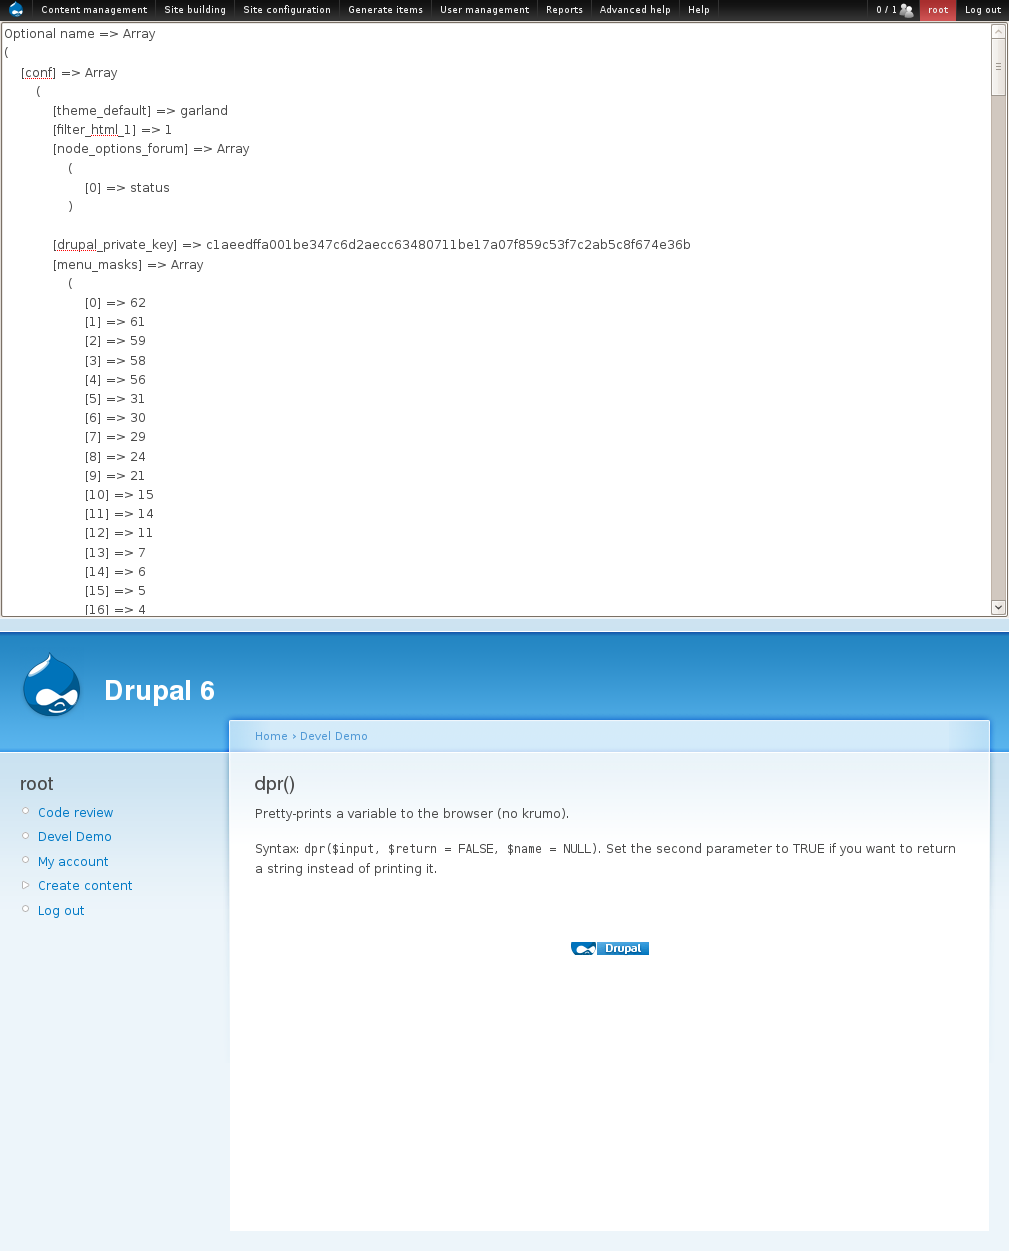
dpr()
Pretty-prints a variable to the browser (without using krumo). The output is displayed in the page header, making this a good choice if your theme doesn’t print the $messages variable.
dpr($input, $return = FALSE, $name = NULL)Set the second parameter to TRUE if you want to return a string instead of printing it.
You can use the $name parameter to distinguish between different calls to dpr().
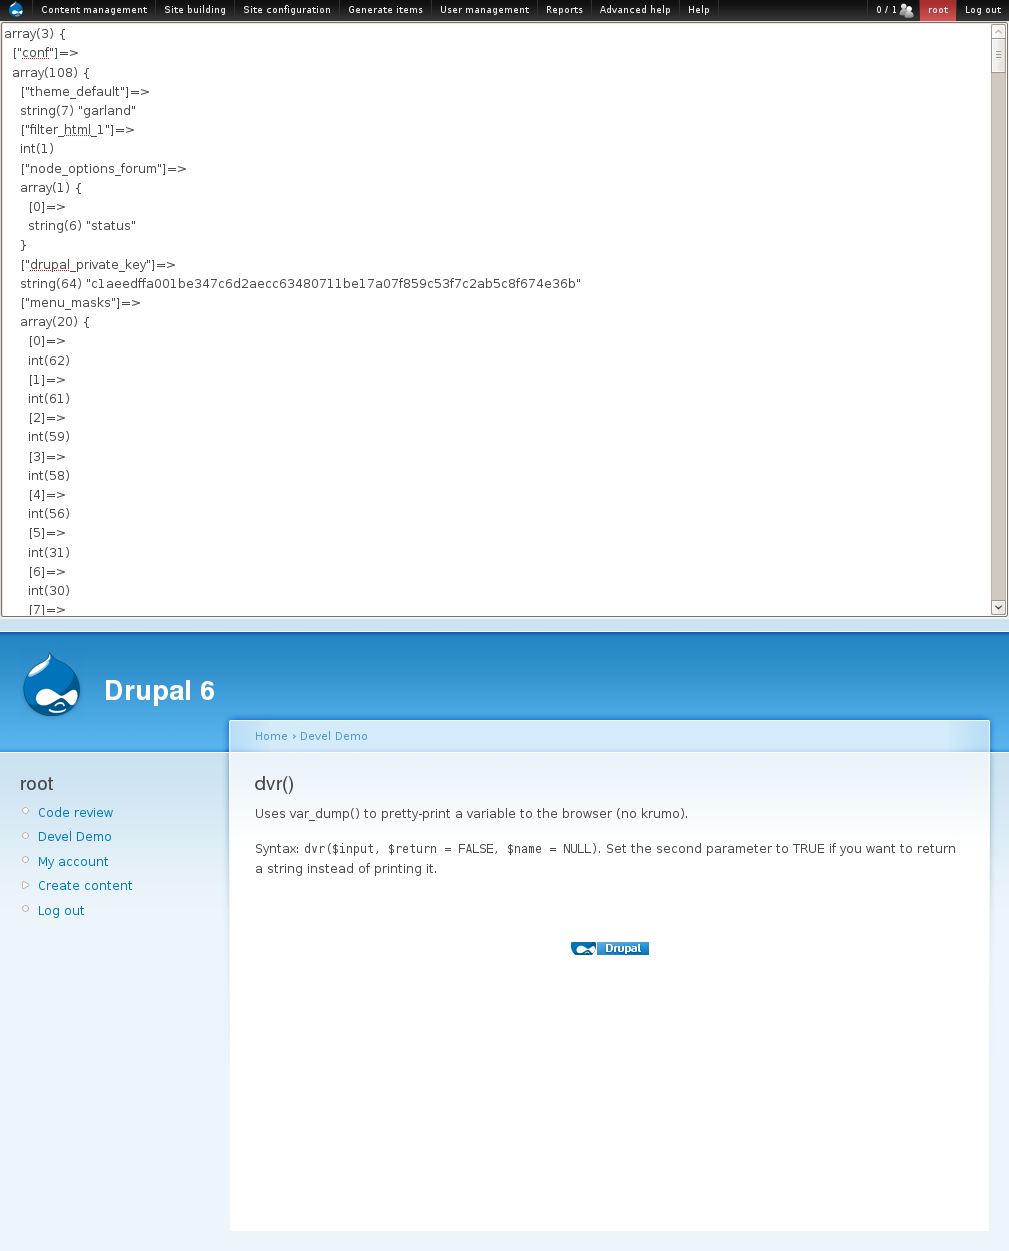
dvr()
Uses var_dump() to pretty-print a variable to the browser (without using krumo). The output is displayed in the page header, making this a good choice if your theme doesn’t print the $messages variable.
dvr($input, $return = FALSE, $name = NULL)Set the second parameter to TRUE if you want to return a string instead of printing it.
You can use the $name parameter to distinguish between different calls to dvr().
kpr()
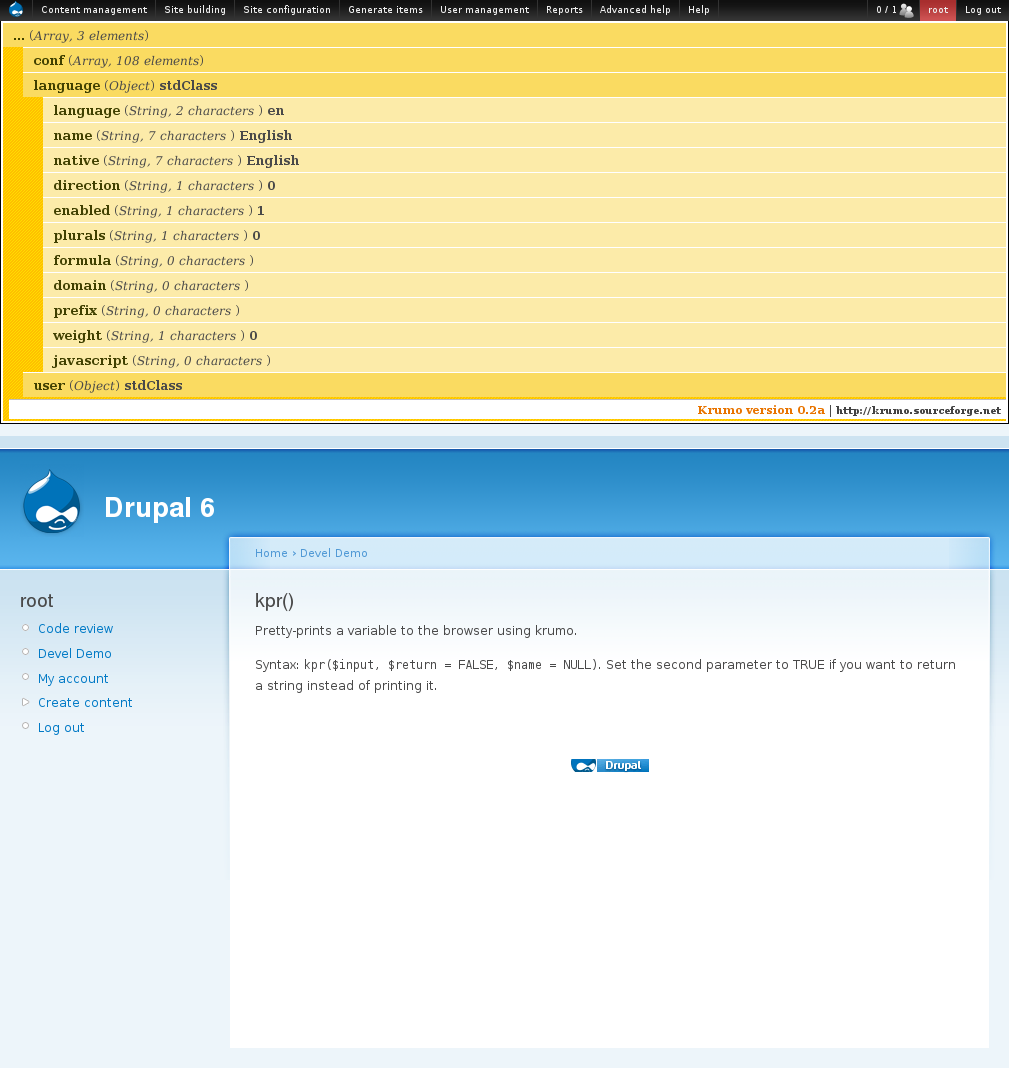
Pretty-prints a variable to the browser using krumo. The output is displayed in the page header, making this a good choice if your theme doesn’t print the $messages variable. Since it uses Krumo, it has the added advantage that the output is very compact and unobtrusive.
kpr($input, $return = FALSE, $name = NULL)Set the second parameter to TRUE if you want to return a string instead of printing it.
dargs()
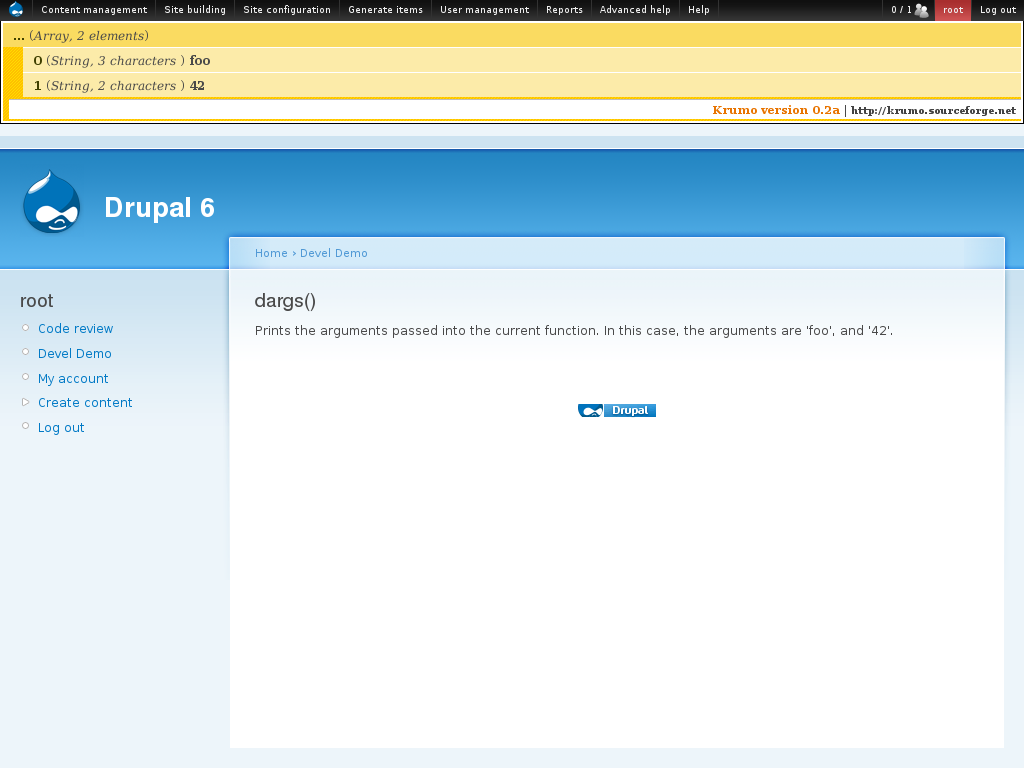
Prints the arguments passed into the current function. In this case, the arguments are ‘foo’, and ‘42’. You can use this function if you’re not completely sure of the arguments received by a specific Drupal hook or function in the code you’re working on.
dargs()dd()
Logs any variable to a file named “drupal_debug.txt” in the site’s temp directory. All output from this function is appended to the log file, making it easy to see how the contents of a variable change as you modify your code.
If you’re using Mac OS X you can use the Logging Console to monitor the contents of the log file.
If you’re using a flavor of Linux you can use the command “tail -f drupal_debug.txt” to watch the data being logged to the file.
dd($data, $label = NULL)ddebug_backtrace()
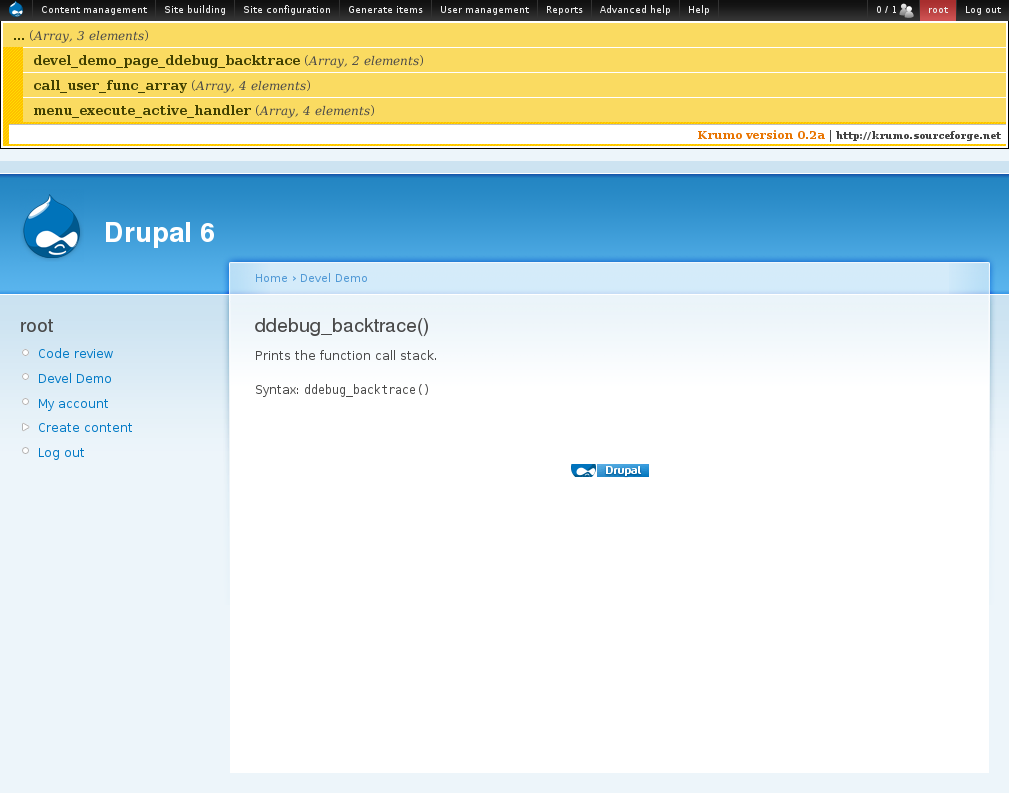
Prints the function call stack.
ddebug_backtrace()db_queryd()
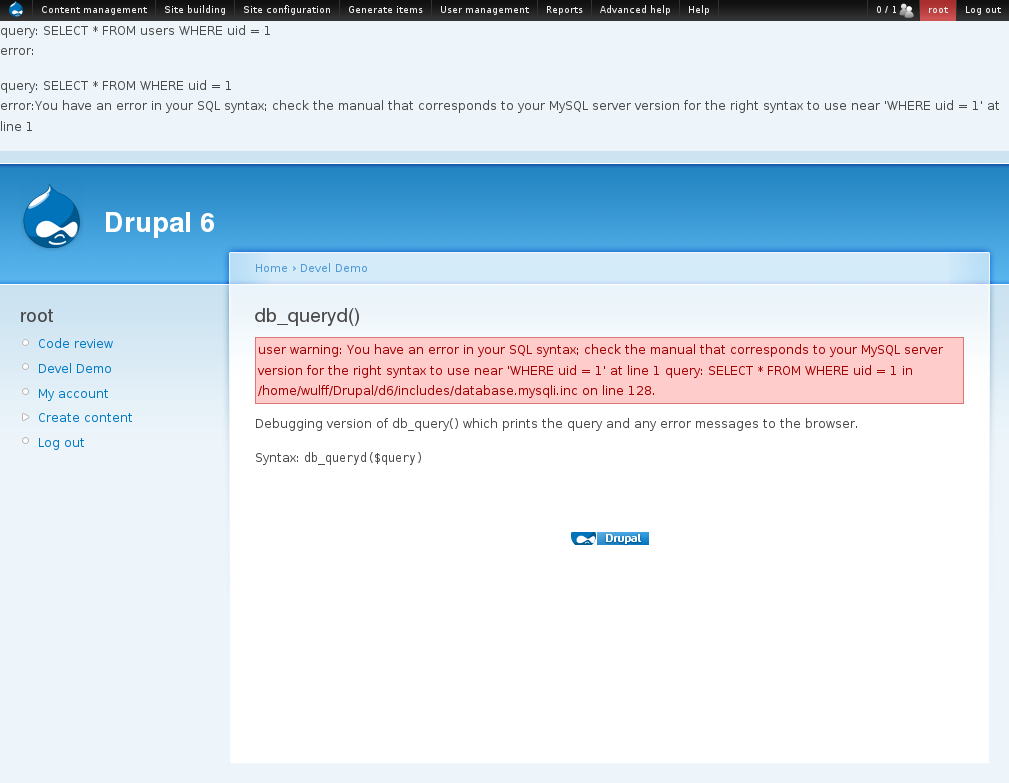
This function is the debugging version of db_query(), which prints the query and any error messages to the browser. This function is useful if you want to monitor a few database queries but don’t need Devel module’s list of all database queries used to build the current page.
db_queryd($query, $args = array())Drupal for Firebug
All the examples in this section assume that you are running a recent version of Firefox with the Firebug add-on.
Please note that Drupal for Firebug doesn’t seem to work with the Theme developer module from the Devel package.
Installation
- Install the Drupal for Firebug module
- Install the DrupalForFirebug Firefox add-on. You can find a link to the current version on the Drupal for Firebug project page.
When you have installed the Firefox add-on, go to Administer → Build → Modules and enable the two Drupal for Firebug modules.
In use
Once you have installed the add-on and enabled the modules, a new Drupal tab becomes available in Firebug. The following sections describe each subtab.
General
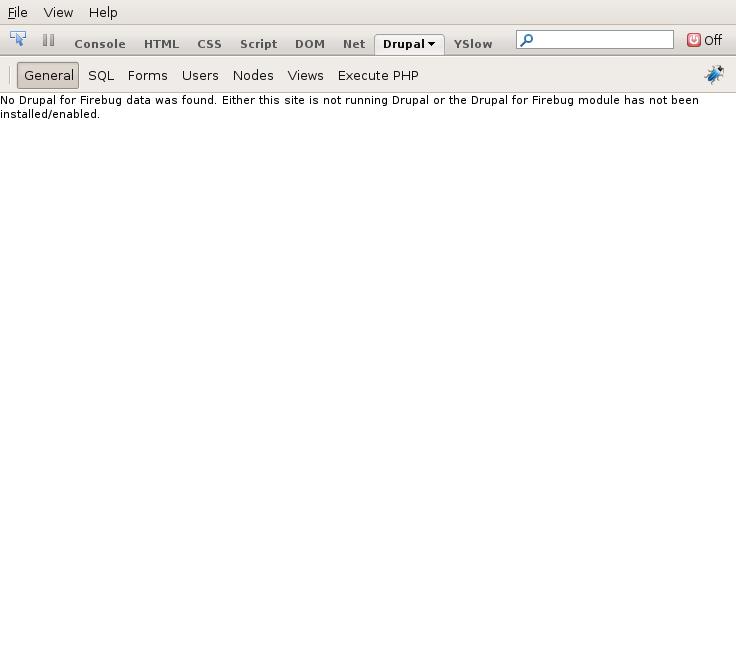
The general tab serves as a general log area for Drupal for Firebug. It tells you whether the site you’re looking at is running Drupal and has Drupal for Firebug installed and enabled.
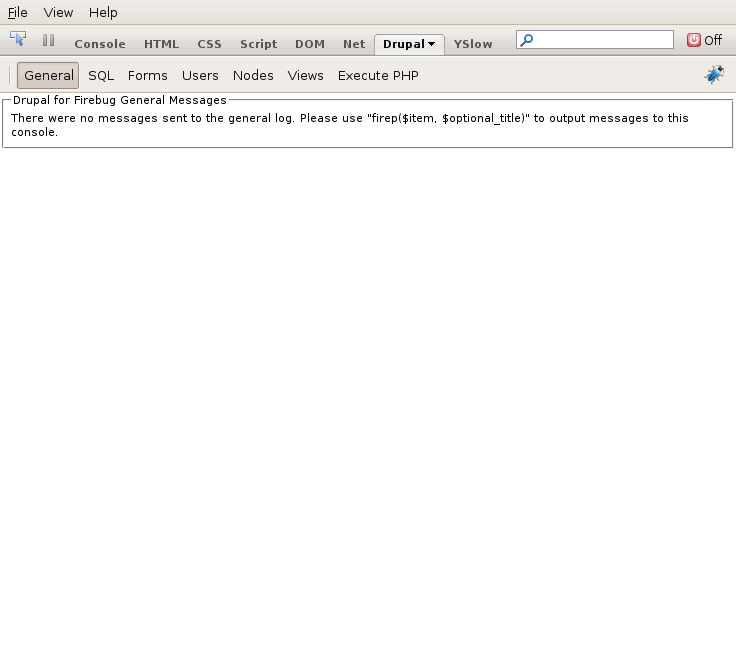
If you want to keep your Drupal-related log messages out of the normal Firebug console, you can write messages to the Drupal for Firebug log with the firep() function:
firep($item, $optional_title)You can see example output in the screenshots “General: Off” and “General: On” below.
SQL
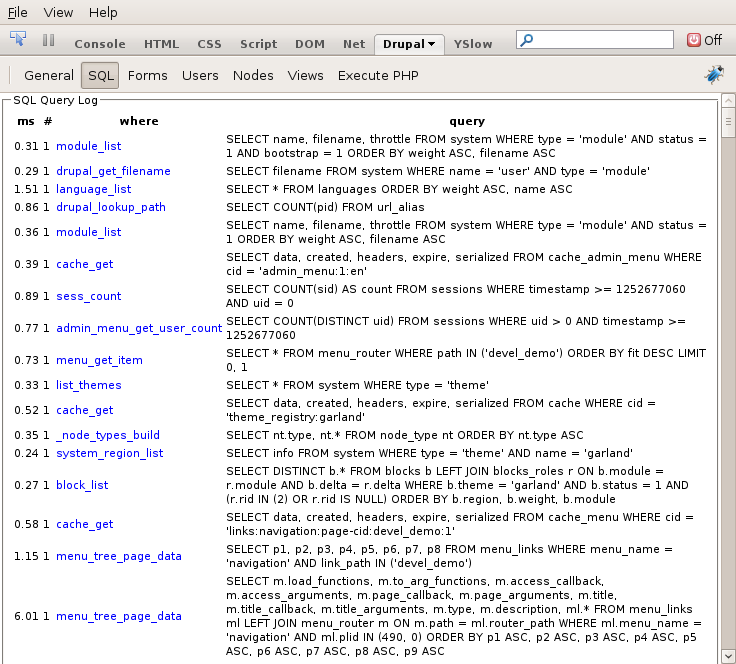
To use the SQL tab you must first enable query info collection. Go to Administer → Site configuration → Devel settings and mark the checkbox labelled “Collect query info”.
The SQL tab now displays a list of all the database queries which have been made to build the current page. This is essentially the same output displayed by the Devel module when “Display query log” is enabled, but you can use the SQL tab if you don’t want the list of database queries cluttering up the page display.
Forms
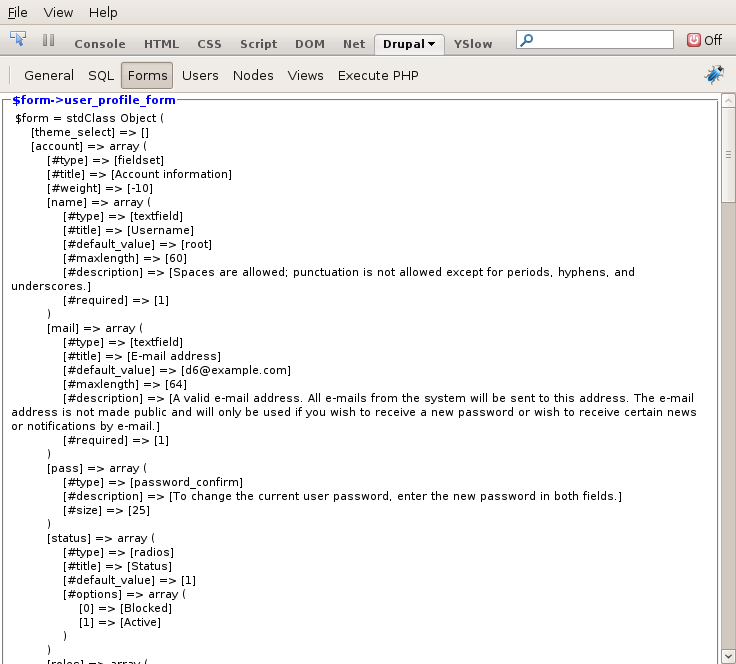
The Forms tab displays the form arrays used to build the forms on the current page. This can be useful when trying to identify the right array key to use when modifying or removing a form element.
Users
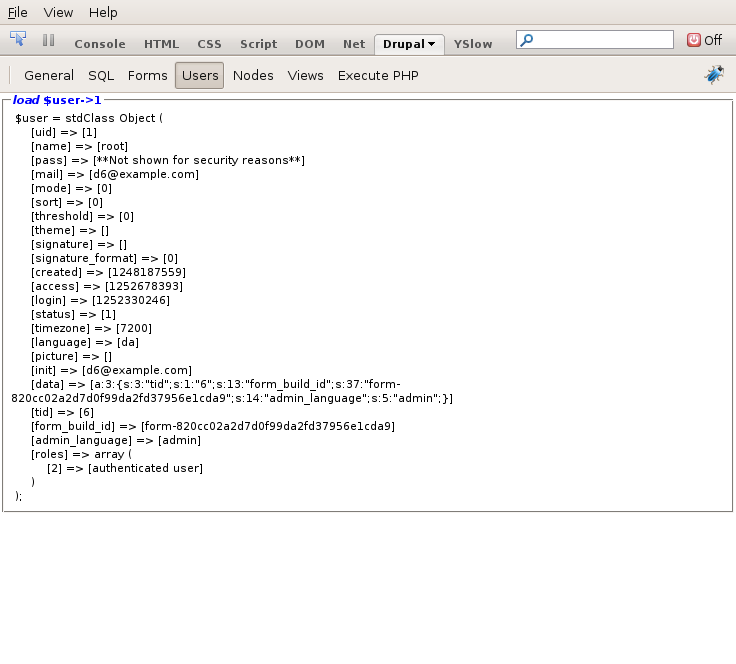
The Users tab displays the $user object associated with the currently logged-in user, or with the anonymous user if the current session isn’t logged in.
In order to see the output for users other than the root user (UID = 1), you must grant the user the “Access Firebug Debug” permission.
Nodes
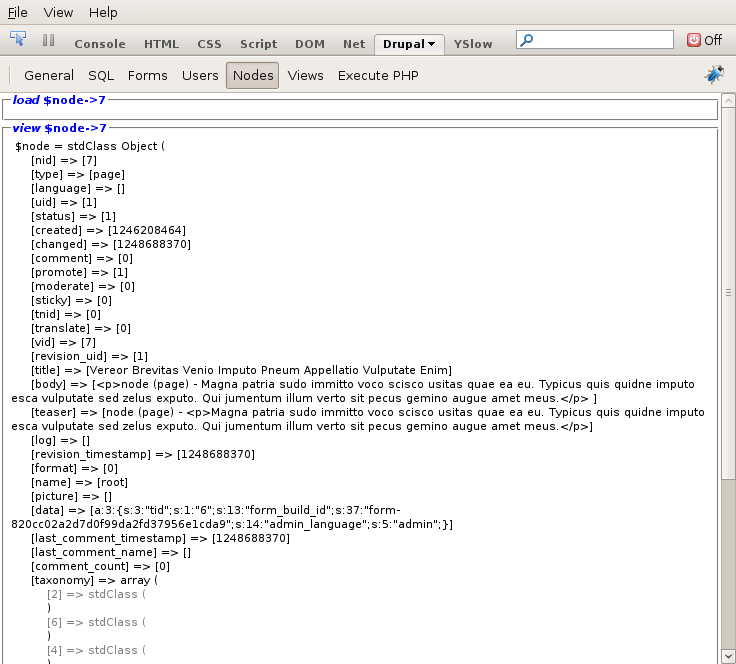
The Nodes tab displays information about every node loaded on the current page.
The output shows the contents of the node object after it has been loaded, after the view phase, and after the alter phase. This is useful for determining the point at which the contents of the node are being modified. Also, this is a handy way of obtaining an overview of the available node fields when developing custom node templates.
Views
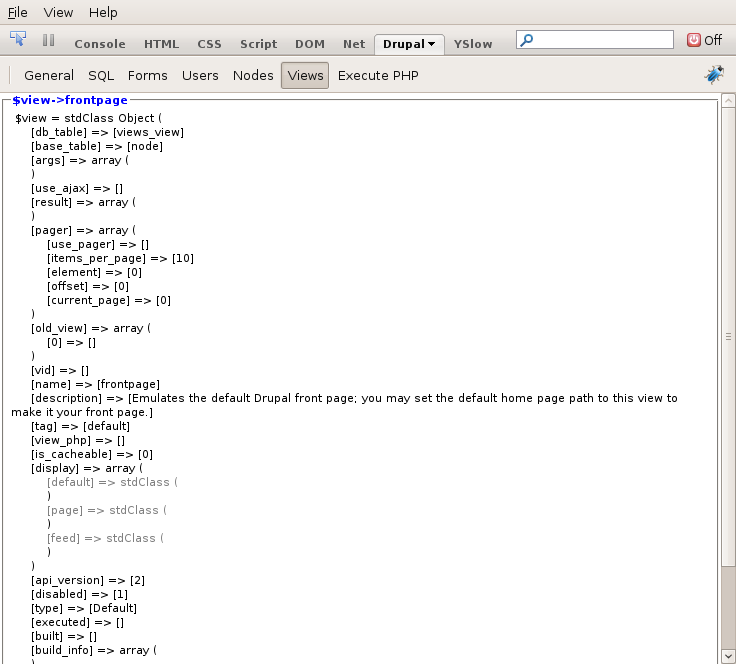
The Views tab displays information about the views on the current page.
You can use this tab to gain an overview of the types of displays used, the base tables, and the pager settings of the different views.
Execute PHP
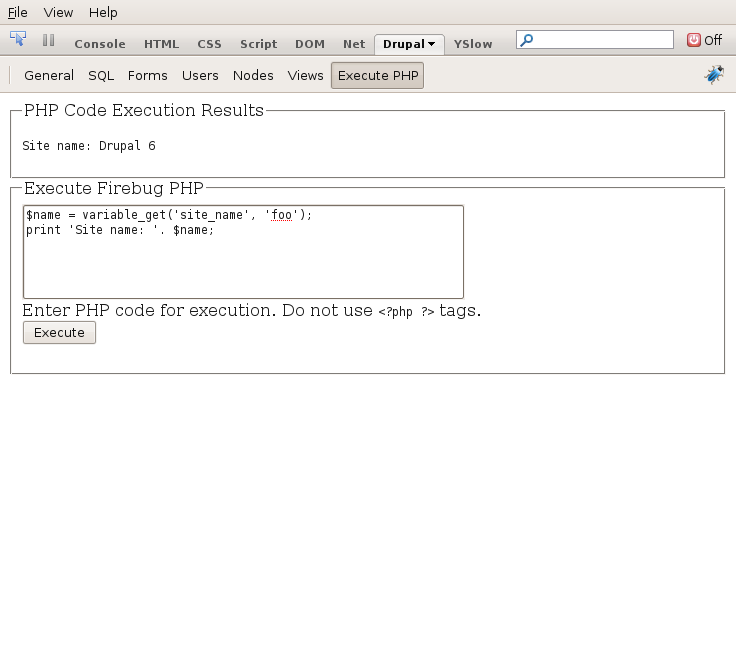
The Execute PHP tab lets you execute PHP code in the context of a fully bootstrapped Drupal instance. This can be useful when you want to check the output of functions which do not display any data in the frontend. Also, you can use it to make quick checks on the values of Drupal variables or global variables.
All the code you execute will behave as if it were implemented as a page callback for the path “admin/firebug/exec”.
Only users with the “Execute Firebug PHP” permission can use this tab.
FirePHP
All the examples in this section assume that you are running a recent version of Firefox with the Firebug add-on, and that the Devel module is enabled.
Installation
- Install the FirePHP Firefox add-on.
- Download and install the FirePHP library per the instructions in Devel module’s README file.
In use
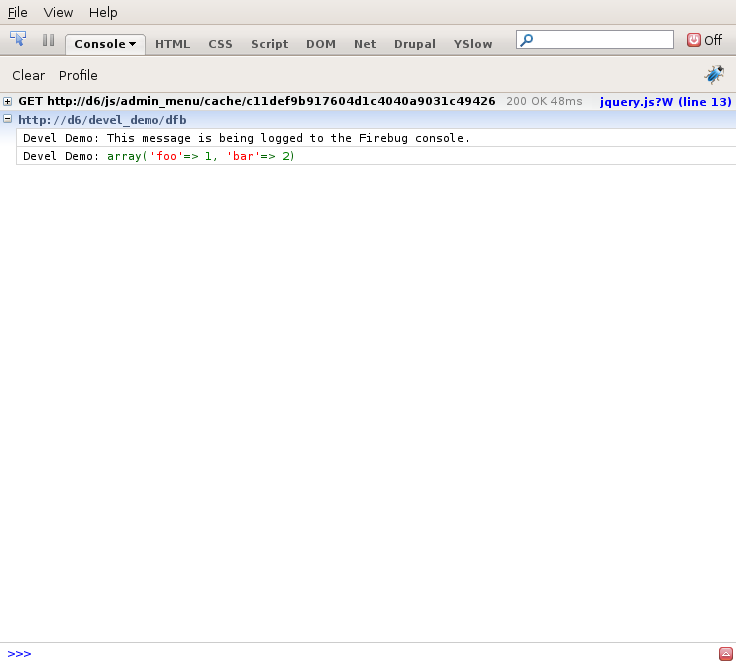
dfb()
You can use the dfb() function to write log messages directly to the general Firebug console.
dfb($input, $label = NULL)Set the $label parameter to distinguish log messages from different parts of the code (i.e. a function name, a module name or another identifier).
dfb() with severity levels
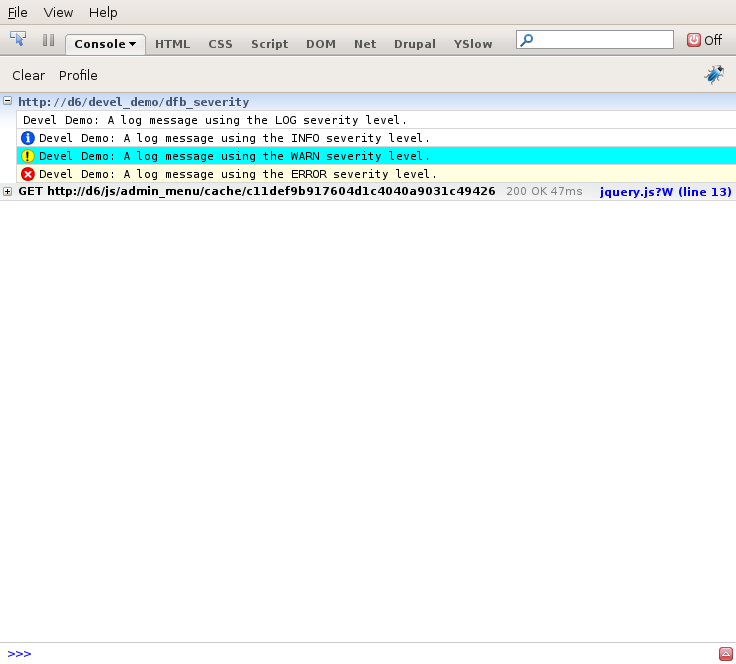
It is possible to write log messages with different severity levels by adding an extra parameter to the function call:
dfb($input, $label = NULL, $severity = FirePHP::LOG)You can choose from the following severity levels:
- FirePHP::LOG A normal log message
- FirePHP::INFO Adds a blue information icon to the log message
- FirePHP::WARN Adds a blue information icon and a cyan background color to the log message
- FirePHP::ERROR Adds a red error icon to the log message and displays a Firebug error in the status bar
XDebug & NetBeans
At the moment this guide is only available for Ubuntu. This part of the guide assumes that you have a running Ubuntu system with Apache, MySQL and PHP installed, and that they are configured to run Drupal locally. Installation
- Download and install the PHP version of NetBeans.
- Install the php5-xdebug-package using Ubuntu’s built-in package manager.
In use
Create a project in NetBeans
- Choose File → New Project…
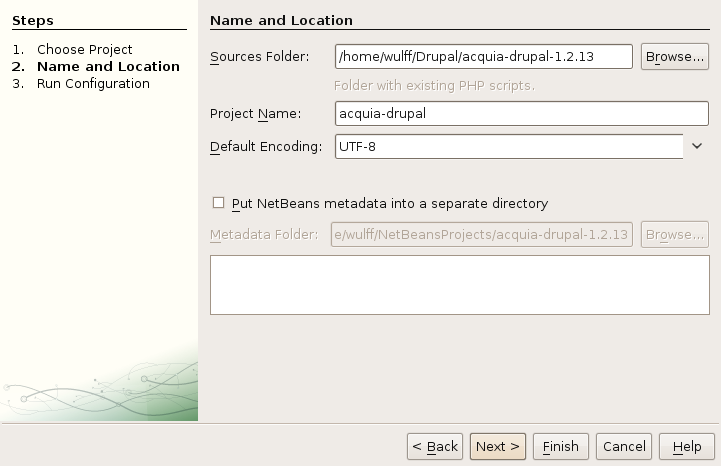
- Select PHP Application from Existing Sources
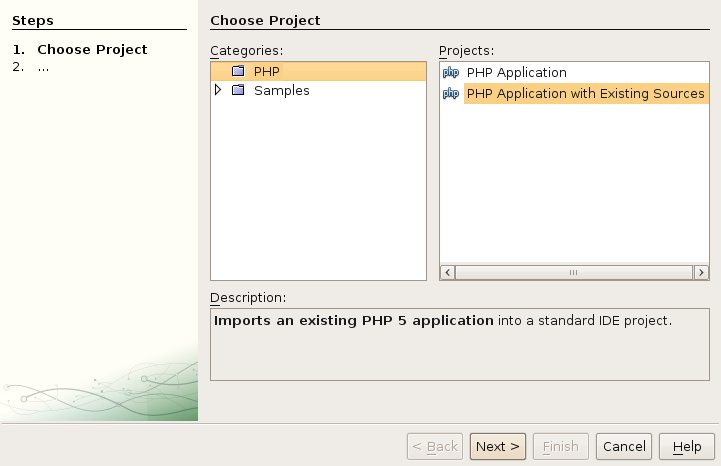
- Select the root folder of your Drupal project and choose a name for your project. In most cases it’s easiest to let NetBeans store the metadata in the Drupal root directory since you can just tell your VCS to ignore this folder
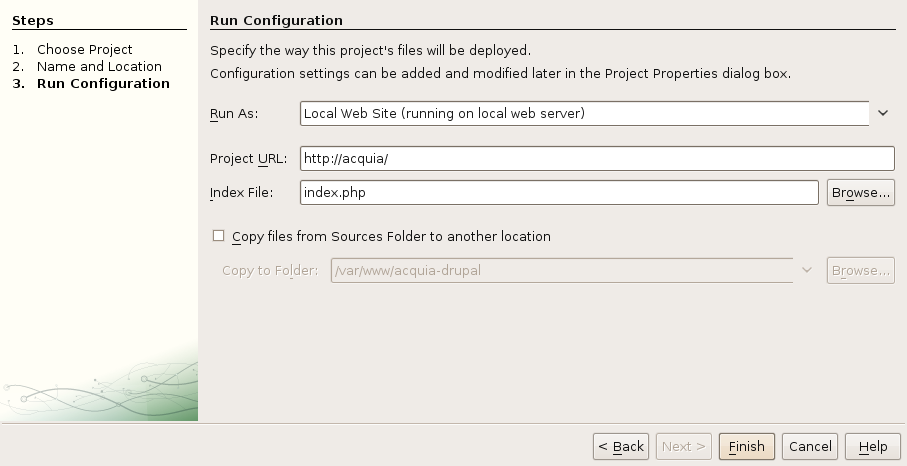
- Choose Run as Local Web Site and enter the local URL you use to access the site
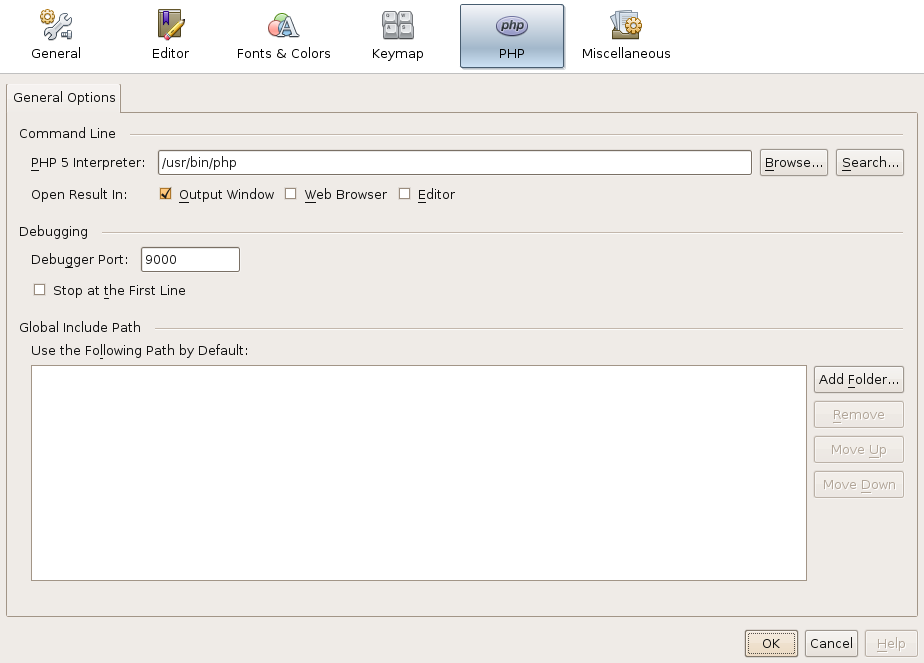
- Go to Tools → Options
- On the PHP tab uncheck the box “Stop at the First Line” to make sure the debugger only stops if you have set one or more breakpoints
Start debugging
- Open the file you wish to debug
- Add one or more breakpoints by clicking on a line number in the margin or by pressing CTRL+F8
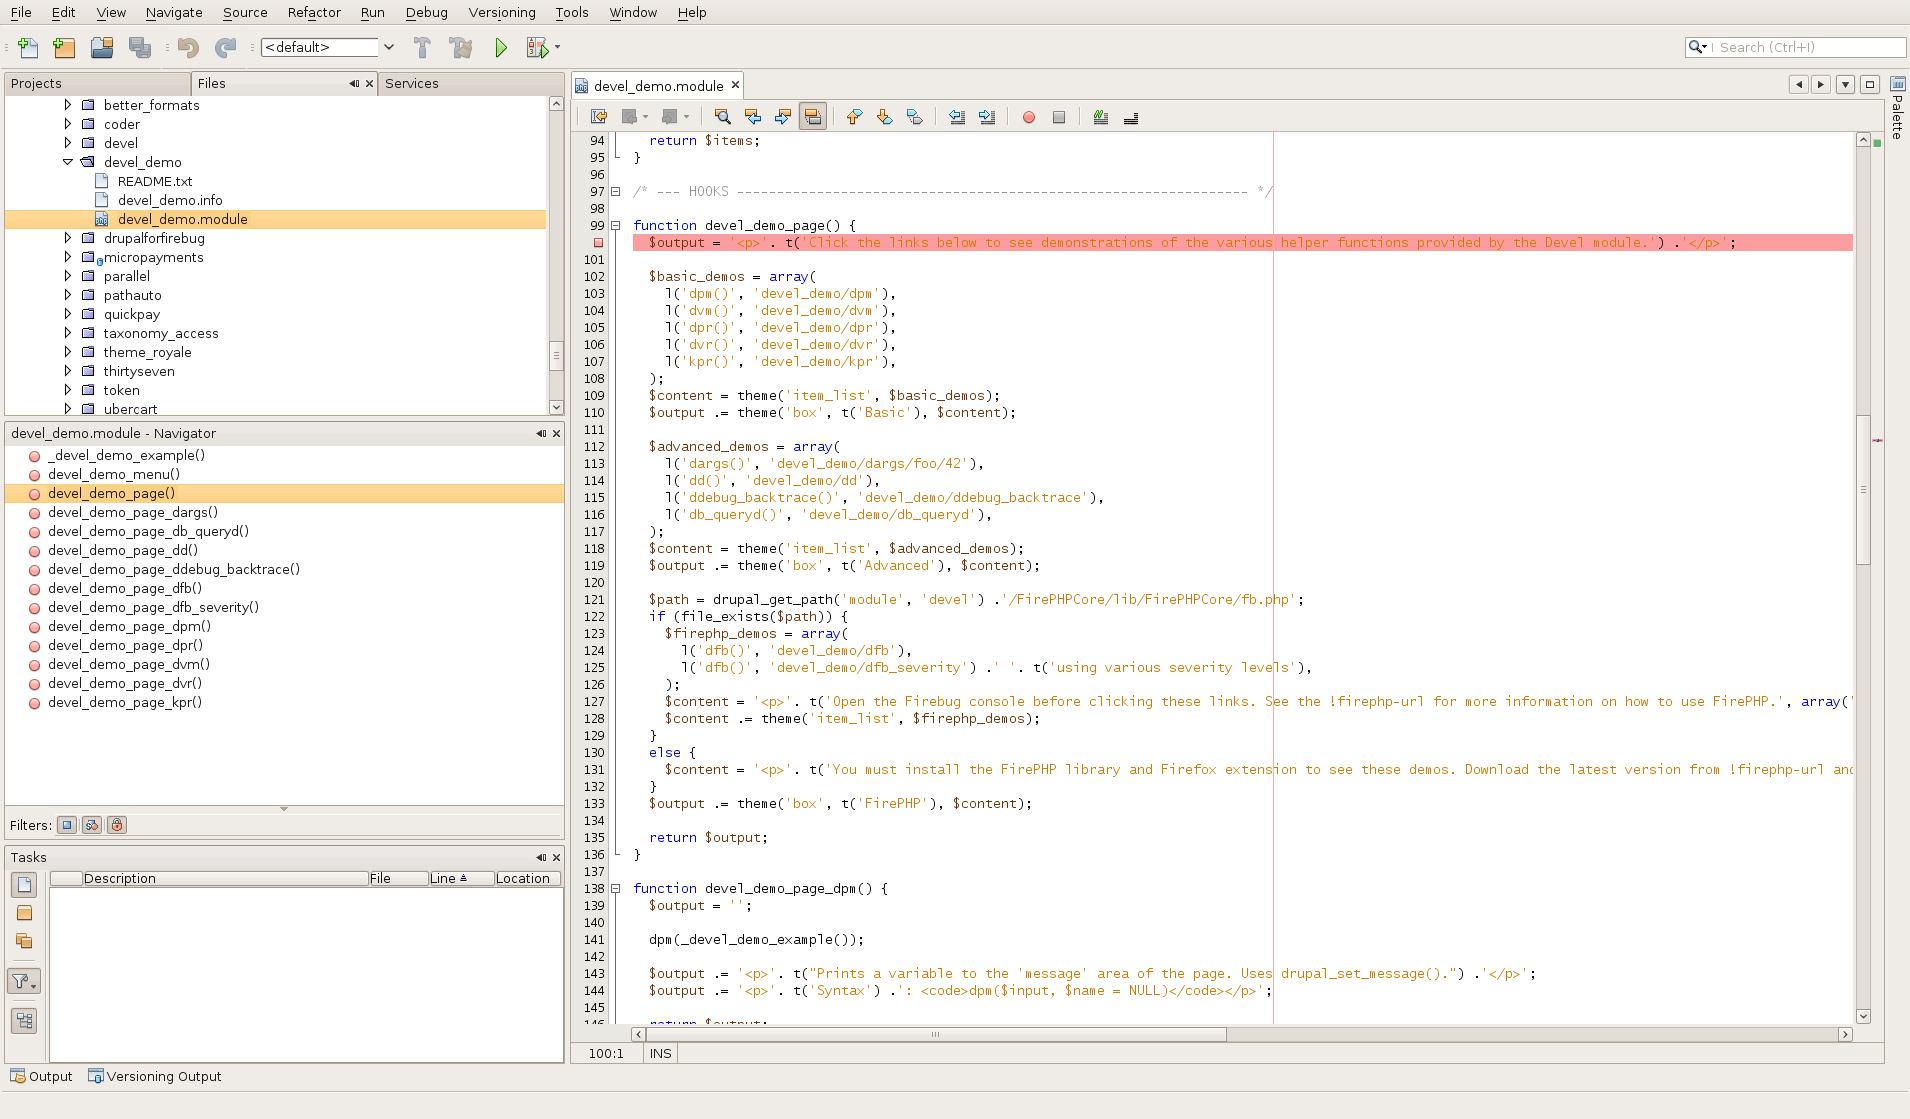
- Choose Debug → Debug project or press CTRL+F5
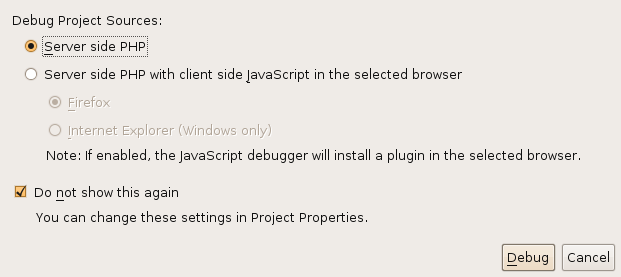
- Choose Server side PHP and click Debug. Check the box “Do not show again” if you don’t want to be presented with this dialog every time you start the debugger
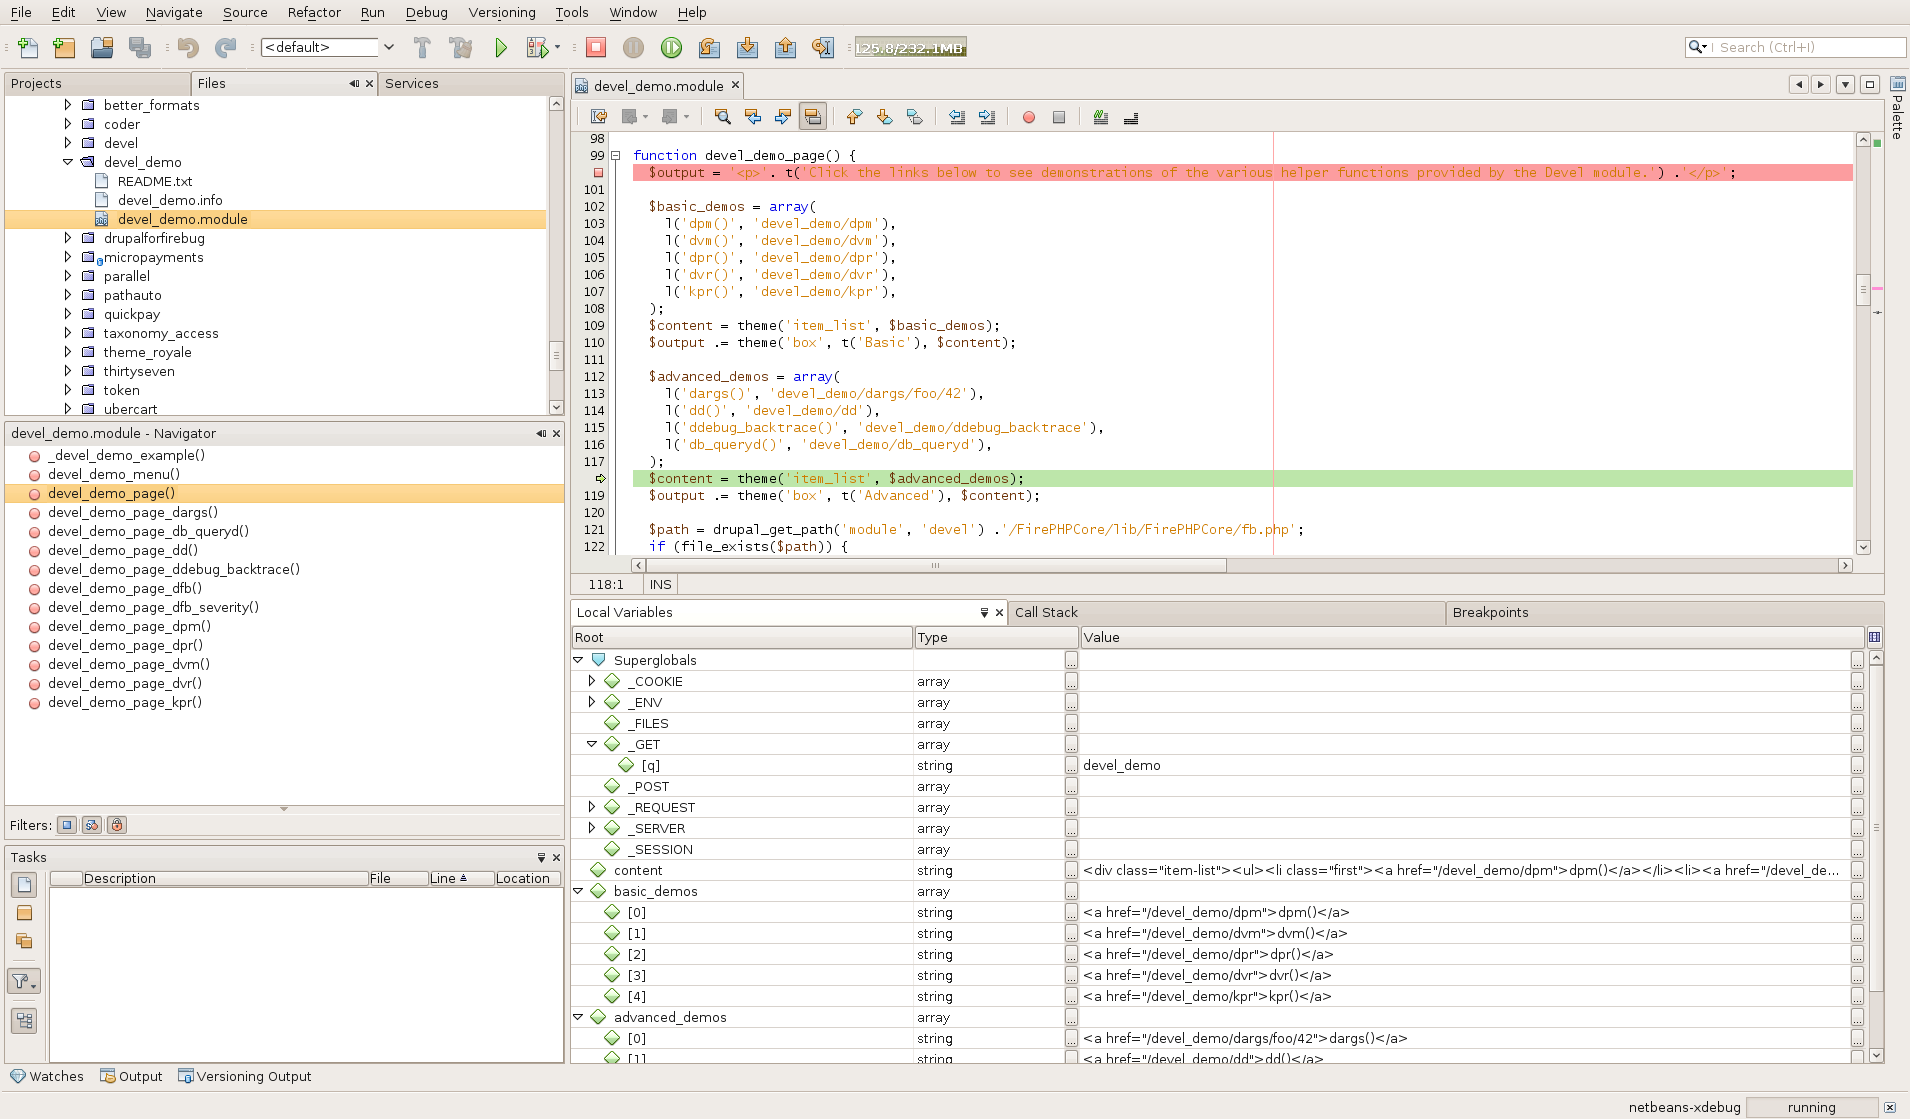
When the debugger is running you can use the Local Variables tab to display the contents of all the variables which are currently in scope as well as all superglobals.
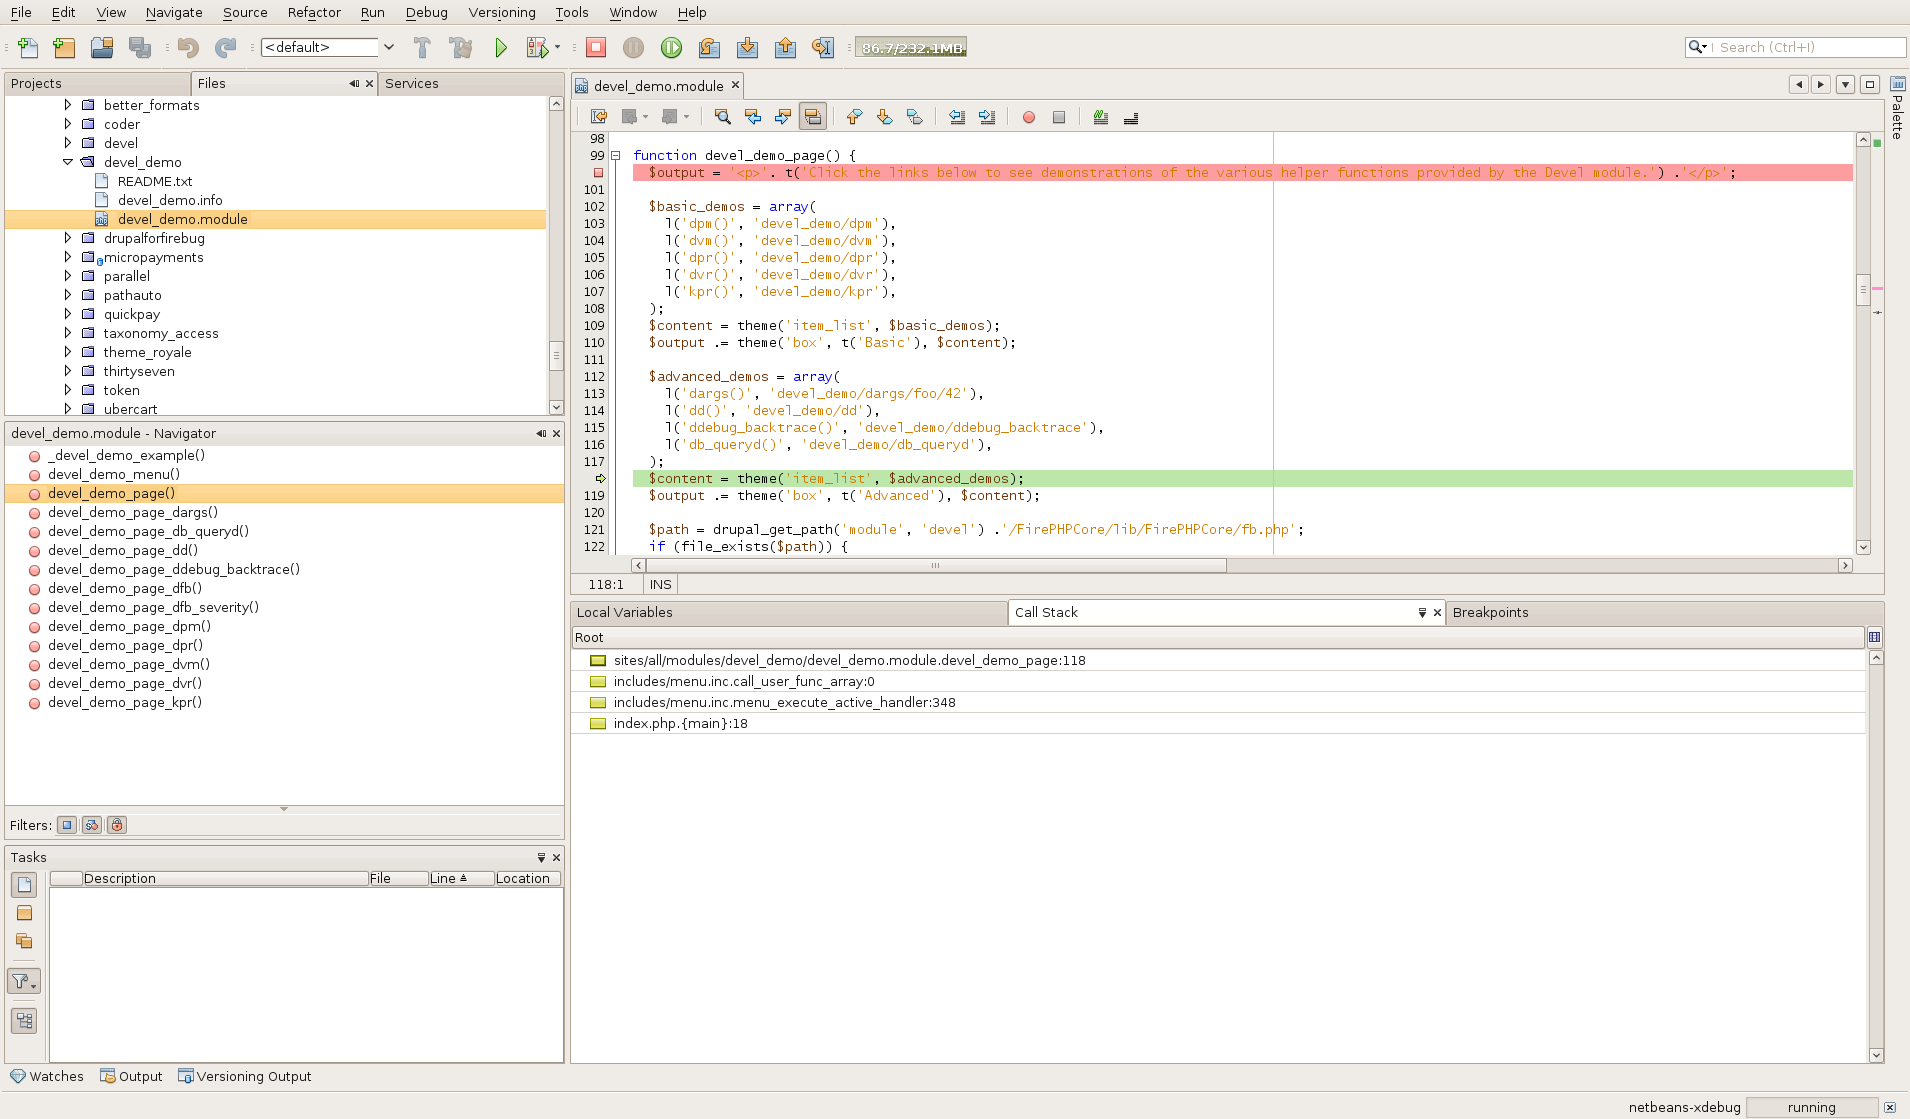
The Call Stack tab shows the current position in the call stack.
You can add more tabs by going to the Window → Debugging menu in NetBeans.
Keyboard shortcuts
Use the following shortcuts to step through the code when running under the debugger:
| Key | Action |
|---|---|
| F5 | Continue |
| F8 | Step over |
| F7 | Step into |
| CTRL+F7 | Step out |
| F4 | Run to cursor |
Profiling with Xdebug
In addition to its basic use as a debugging tool, you can also use it to profile your code. This is a two-step process: First you use Xdebug to generate a cachegrind output file. Then, you use a tool like Webgrind to analyze the output file.
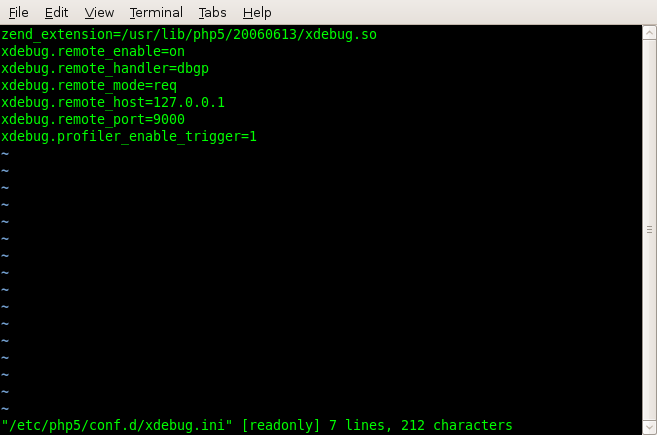
If you have Xdebug installed and configured, you can enable profiling by adding this line to your xdebug.ini file:
xdebug.profiler_enable_trigger=1The xdebug.ini file can usually be found in /etc/php5/conf.d/.
To create the cachegrind file, add an ?XDEBUG_PROFILE query parameter when loading a page on your site:
drupal.local/?XDEBUG_PROFILEThis generates a cachegrind.out.<pid> file in your /tmp directory.
To analyze the output file you can install a tool like Webgrind on your local web server:
- Get the latest copy of Webgrind.
- Install it in a local directory and create a virtual host for it, so you can access it at http://webgrind/.
When you access the Webgrind frontpage, you can use the dropdown box at the top of the screen to select the cachegrind file you want to analyze.
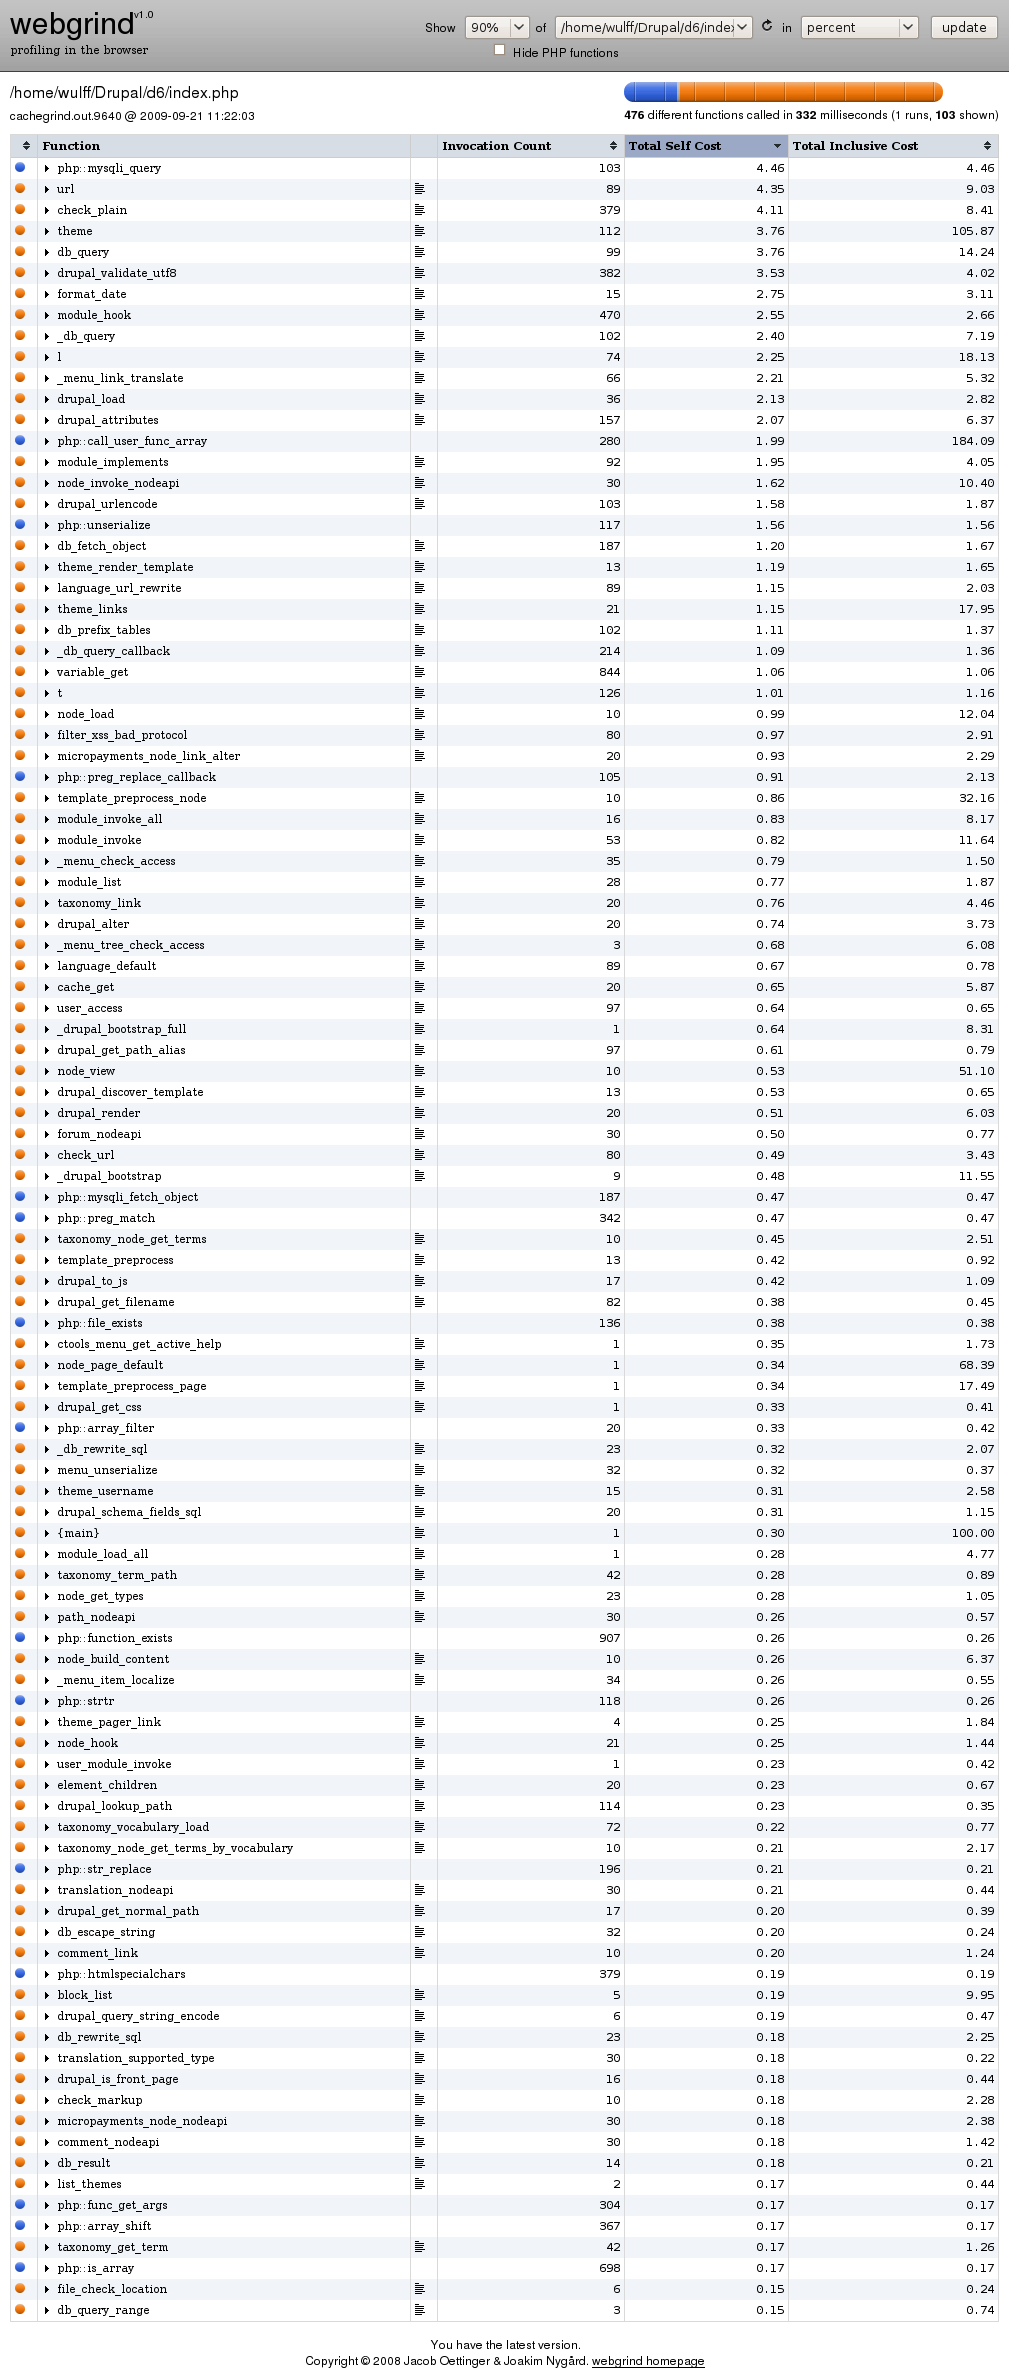
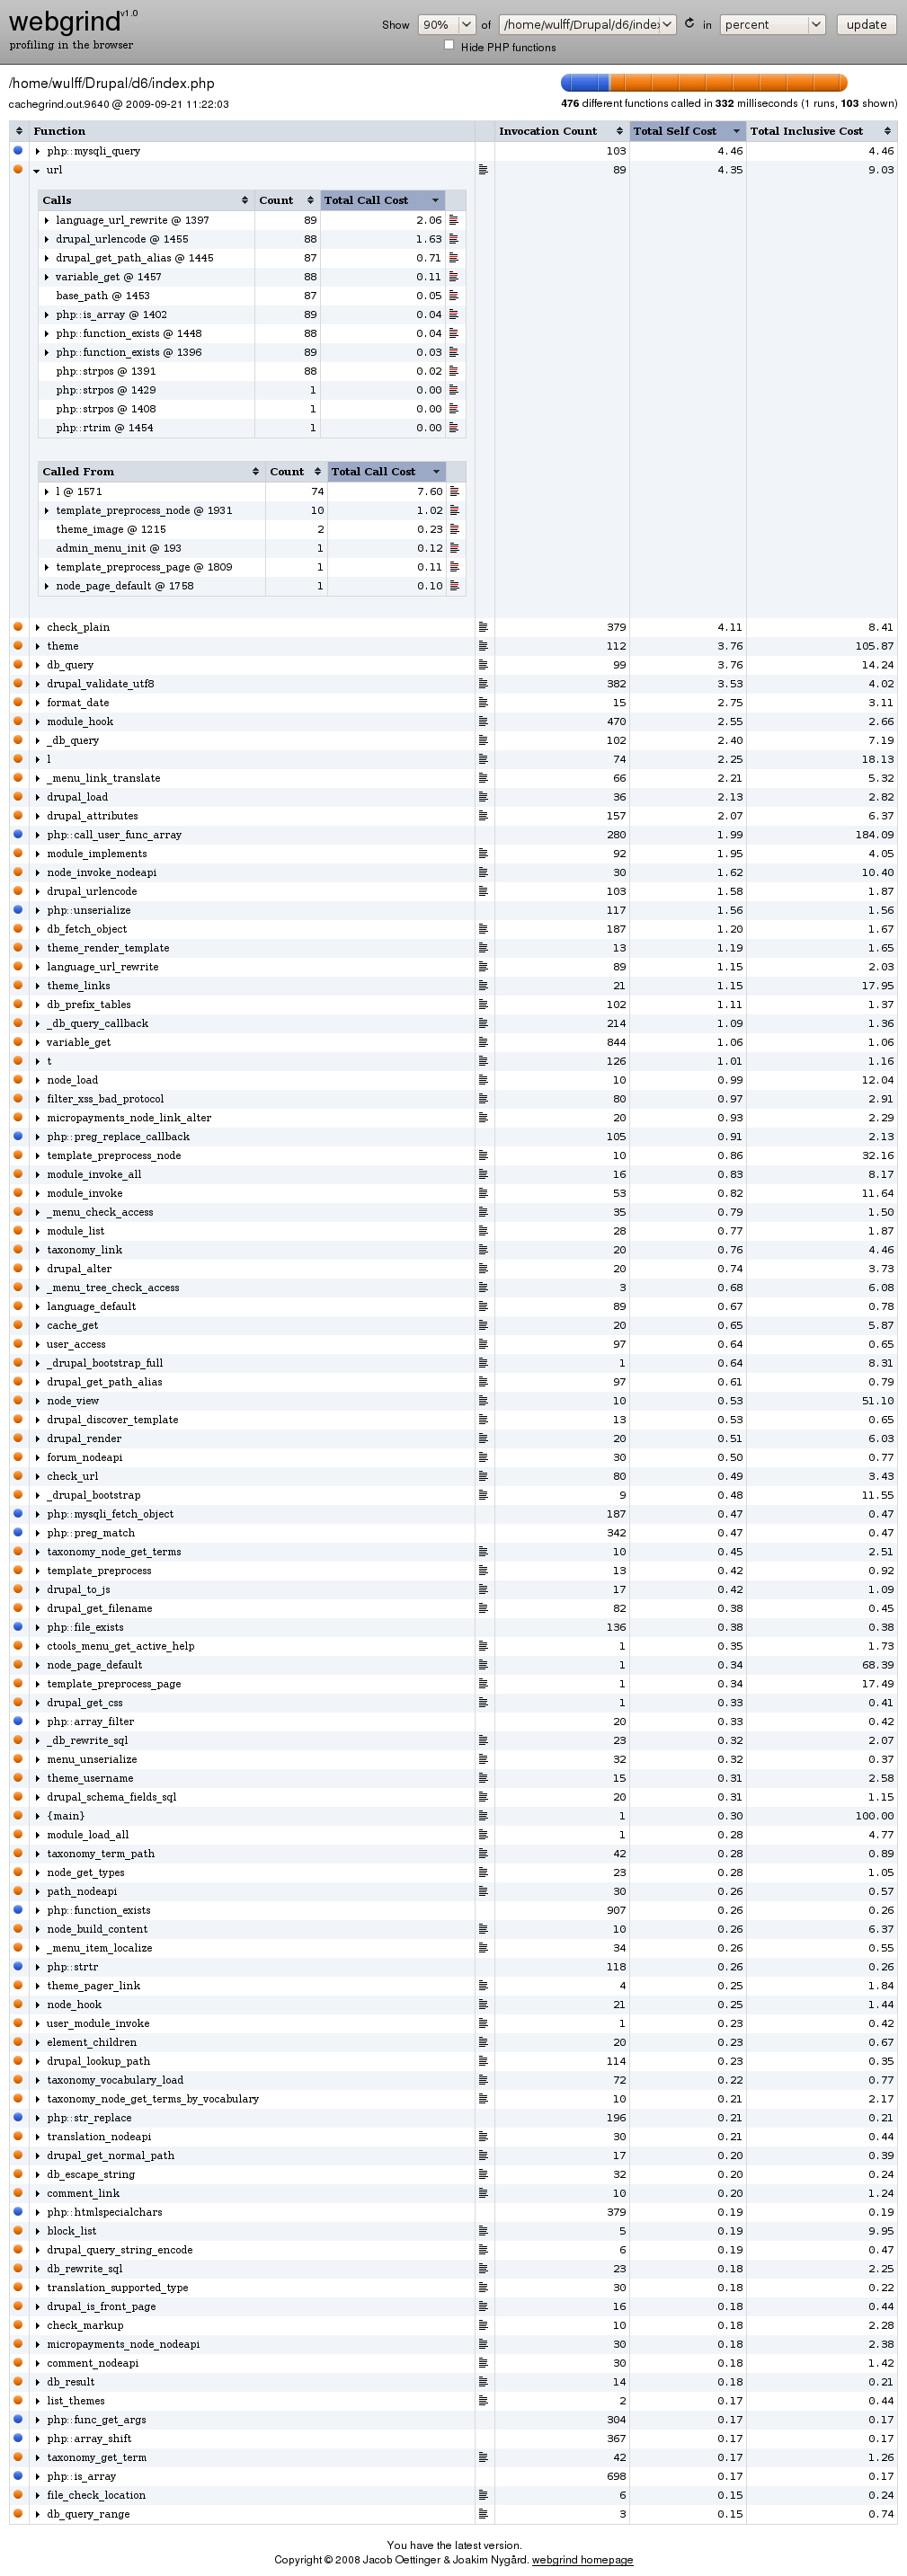
After processing the file webgrind displays a list of all the functions which where called to build the current page. See the screenshots below for example output.
